Following the publication of Friday of Stripy Nanoparticles Revisited, one colleague wrote the following to me “I guess now you have to reply to Francesco’s response“.
My hope is that scientists will read carefully both articles, as well as the primary articles, and come to their own conclusions regarding the existence and properties of stripy nanoparticles. Having said that, I am happy to discuss any particular question asked by readers (within time constraints…).
Here, I comment just on one particular point which relates to simple understanding of scanning microscopy and to our first argument, i.e. that the images are not compatible with the stripy hypothesis for basic geometric reasons: if stripes are regularly spaced in 3D they cannot be in a 2D projection.
In the response, the authors address this point as follow:
Hence, the central argument in Lévy’s paper is based on two assumptions: (1) an STM tip moves horizontally on a sample, and (2) tunneling currents flow perfectly vertically from the tip into the substrate holding the sample. Both assumptions are invalid. In reality, the tip follows the contour of the sample. [ 23 ] The correct projection of the sample features being imaged with STM is onto the true tip trajectory, not onto an imaginary flat line. If we assume a tip trajectory that maintains a constant distance from the particle’s center of mass (hence making a semicircular trajectory), then images of the idealized particle shown in ref. [ 1 ] would be projected onto such a semicircle and consequently should show stripes with a spacing of ∼ 1 nm. It should be noted that, were the tip to really move horizontally over the sample, there would be no feedback needed, no feedback loop-artifact possible, and the whole interpretation of the images presented in ref. [ 1 ] (feedback loop artifacts) would be in contradiction with the initial argument
Our argument is not based on the assumption that “an STM tip moves horizontally on a sample“. Indeed, during a standard STM scan, the feedback loop attempts to keep the tip-sample distance constant and therefore the tip follows the contour. We simply state the obvious, i.e. that an STM image is a 2D projection of a 3D surface. Each line in an STM image represents (as a color) the vertical movement of the tip as a function of the horizontal displacement. Incidentally, if scanning microscopy worked as described in the paragraph quoted above, the image of a square area… would not be square since each line would have different length depending on the topology of the surface.

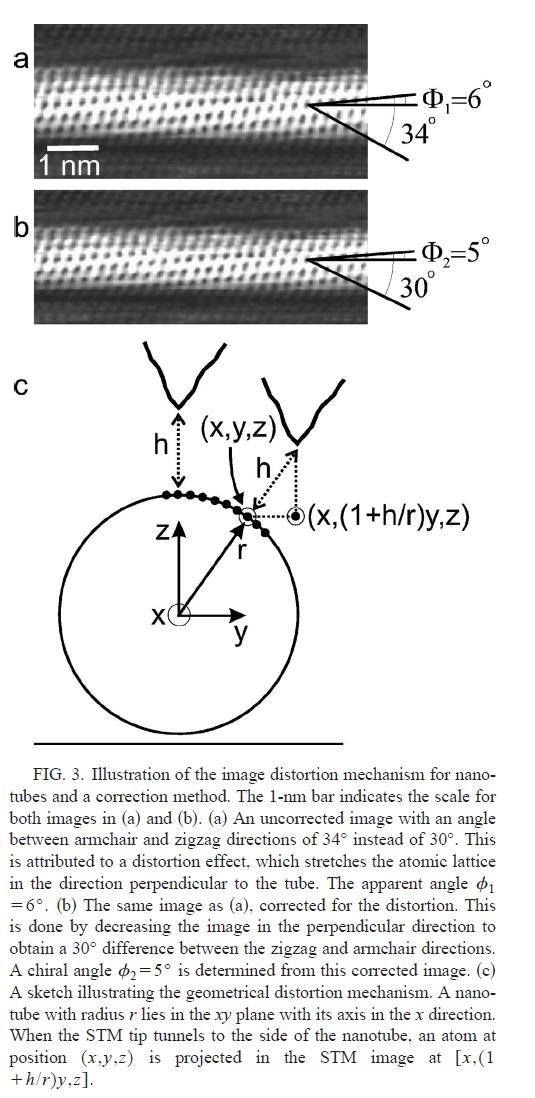
Venema et al, Fig 3, reproduced from Phys. Rev. B 61, 2991–2996 (2000)
Atomic structure of carbon nanotubes from scanning tunneling microscopy

Raphaël, would you mind clarifying the above?
Replying to the paragraph you quote above from Stellacci’s Response,
“If we assume a tip trajectory that maintains a constant distance from the particle’s center of mass (hence making a semicircular trajectory), then images of the idealized particle shown in ref. [ 1 ] would be projected onto such a semicircle and consequently should show stripes with a spacing of ∼ 1 nm.”,
you write:
“Incidentally, if scanning microscopy worked as described in the paragraph quoted above, the image of a square area… would not be square since each line would have different length depending on the topology of the surface.”
I do not understand your point and it seems to me that the figure above is misleading, as the sphere is comparable in size to the square, whereas the height of the stripes is much smaller than the diameter of the nanoparticles.
In fact, it seems obvious to me that if the tip follows the nanoparticle surface at a constant distance from the particle’s centre of mass, if the stripes are regularly spaced in 3D they will also be regularly spaced in the resulting 2D projection.
LikeLike
Pep; I am always happy to help with elementary SPM (this is even more elementary than the feedback issue).
The figure above does not show nor seek to show the stripes.
On the left you have an image of an hemisphere. The grey level indicates the height. You would obtain this kind of picture if you do a scanning probe microscopy image of an hemisphere.
In SPM, often (and in the papers we discuss, always), you scan trying to keep a constant distance from the sample using a feedback, and you plot the z displacement as a function of x for each line.
Let say you scan a 100 nm by 100 nm square. Your image will represent this area.
Because your tip is following the profile of the surface, for each line, the length of the tip trajectory will always be longer than 100 nm and will vary from line to line. In my example above, the length of the scan lines will be 100 nm long until you start scanning over the particle, then become longer, etc. But your image will always be square: you plot the z displacement, coded as a grey level, with white being high, and black being low, as a function of x. For each line the x displacement is constant : 100 nm.
As for your last paragraph, if you could flesh it up a bit, I am sure you could publish it in high impact journal because if it was possible to do 2D projections which do not distort distances on a sphere it would have lots of interesting applications, e.g. http://www.nationalatlas.gov/articles/mapping/a_projections.html
LikeLike
Thanks for this, Raphaël.
Of course, if the sphere on top of the square is comparable to the size of the square, the run of the tip as it scans the sphere will be longer as it goes higher on the sphere. This is obvious, and your picture above makes it extremely clear.
As I said above, the height of the stripes is much smaller than the diameter of the nanoparticle. If the sphere on the drawing above would have regularly spaced stripes, these stripes would also appear regularly spaced on the scan on the right side of the image. This is why I said your picture may be misleading for the case in point.
Of course, a 2D projection of a sphere is always ‘distorted’, as the transformation involves area stretching, but a 1D projection (each run of the scanning tip) is obviously not: a round necklace with equally spaced gems does not distort the spacing between the gems when you cut it and put it flat on a table.
This is what Stellacci and co-author tell you in the paragraph that you quote on this blog entry.
LikeLike
Thanks for acknowledging that this is what Stellacci and co-author tell us in the paragraph quoted.
It is what they tell us and it is wrong. I am not sure that I can explain it much better than I did. Maybe other readers can have a go?
Here is an attempt anyway. I have added one more explanatory cartoon referring to your necklace analogy so that you see the difference between the projection done in SPM (which preserves x distance but not distances on the sphere – the way SPM works) and the “cut the necklace experiment” which does indeed preserve the distances on the sphere but would result in images of a square area not being square since each scanning line would be of different length (not the way SPM images are generated).
LikeLike
The drawing that you have added seems to explain the difference in argument between you and Stellacci.
Your text above on this post,
“Our argument is not based on the assumption that an STM tip moves horizontally on a sample. Indeed, during a standard STM scan, the feedback loop attempts to keep the tip-sample distance constant and therefore the tip follows the contour”,
is incompatible with the left panel of your new drawing, which assumes that the tip scans horizontally and does not follow the contour of the sampled nanoparticle (that is, the run length of the tip is the diameter of the semisphere in the drawing; instead, the run length of a tip that follows the contour is the perimeter, as the right panel shows).
Clearly, if the pic scans the contour, the projection one obtains is that of the right panel on your new drawing: equally spaced stripes.
LikeLike
@pep: the feedback loop does not attempt to keep the distance from the sample constant. This distance can not be absolutely measured. What it actually does — it is keeping the tunneling current constant. Raphael has demonstrated that solely based on geometrical arguments, Stellacci images are, mildly said, suspicious. And that was a good start.
I wholeheartedly recommend you to pick some STM(SPM) book and review some literature and attempt to understand the feedback loop and the working principle of the instrument. This is where the complexity blows up. STM is NOT a black box.
Fortunately for everyone involved in this controversy , there are some ground rules before we even discuss the periodicity in the images. And those rules are:
1.) reproducibility
2.) scaling of the features with scan size and scan rate (should be invariant)
3.) striations that are initially perpendicular to scan lines must rotate with substrate rotation (please do not even read JACS 2007 made-up argument, unheard of by anybody in the community— scientific claims must be supported by evidence)
4.) the tunneling current must not oscillate with the movement of the piezo
Stellacci images have been continuously failing criteria 1-4 for the past eight years. Yes, once in a while, he comes up with a publication where he cherry-picks data and demonstrates the invariance of the features, but these kind of non-quantitative and unorthodox analysis are fencing with: either scientific folly, given the time scale of 8 years — which would imply the researcher to get the undergraduate level of SPM right — or the lack of ability to understand basic SPM and correctly perform measurements.
LikeLike
Pedrag, I of course know that the feedback loop keeps the tunnelling current constant. This is the usual way to adjust the distance of the tip to the sample.
What I am saying here is that, after reading Raphaël’s Commentary, Stellacci’s response, and Raphaël’s blog entry, my take is that the geometrical argument that Raphaël is putting forward does not apply and is based on a misunderstanding.
As for your technical points 1–4, they are of course important. In this respect, could you please comment on Figs. 3 and 4 from Stellacci and co-authors’ Response in Small?
LikeLike
@pep regarding Figures 3 and 4 in Stellacci response in Small:
Great comment, I was waiting for it 🙂
FIGURE 3:
Each of these sub-images are offline zooms. So for example, stare at sub-image (b) for a minute, and then (d). Now repeat the process for (c)->(e), (g)->(i) and so on. Now, relax your eyes and go have a sip of coffee. If its daylight and it happens to be partly cloudy from where ever you are currently blogging, keep looking at the sky for few minutes. Then, take a deep breath and repeat the algorithm from the above:b->g, c->e,g->i,….
Well I did this experiment to test my vision, and in the sky, I saw Santa, soccer ball, an airplane, even an image of my Dad. Some things I want to see for Christmas.
I think the same applies to Stellacci — he wants to demonstrate how “ripples” are oriented in different directions — and he does it, by misleading the reader, playing with contrast and cherry-picking his data. Connect the dots in any possible way, and you will get “ripples” in all directions: horizontal, vertical — all on the same sub image. For example, look at image
(c). Can you by yourself, and not looking at (e) identify any preferential direction? The same thing applies to b and d, h and j. Now, g and i , and l and n, are a bit more believable. But they are believable because he adjusted contrast to make you believe. Drop the contrast just a bit lower, and then you are back to images b,c,h and m.
*****NO STM EXPERT IN THE WORLD ANALYSES PERIODICITY IN THIS WAY. THIS IS CHERRY-PICKING DATA, MANIPULATION OF ARTIFICIAL SHADING, CONTRAST AND COLORING WITHOUT EVOKING QUANTITATIVE ANALYSIS****
FIGURE 4:
This is really easy one to discredit. If you put a dot on every local maxima on the top of nano-particle, you will create some sort of topology — a set of dots with measurable distances between each dot. Now, rotate the sample and compare the new topology. First, does it contain the same number of dots and are all distances between all pairs of dots the same, i.e. is this truly geometrically rotated topology? I will let you stare at the image, print it at home, magnify, and compare. Let me know what you find out. I know the answer 🙂
pep, the bottom line is that Stellacci is misleading general audience such as you or his referees by cherry picking his data, and providing non-qunatitative proofs such as Figures 3 and 4. This is NOT how STM works. STM is a very quantitative tool. People use it to image molecular orbitals with it. But how do they do it? They scan properly. They scan areas such as 10×10 nm or lower and obtain high resolution molecular images. And they still have troubles eliminating artifacts and noise. Stellacci? Sure, lets scan 100nm x 100nm, present either feedback oscillations and random noise, that sometimes, fortuitously, generate 3 pixel wide striation and present this data as molecular imaging of the surface topology. UNHEARD OF!
As final remark, please notice that Stellacci — while performing his bogus tricks — is contradicting himself. Compare Figure 3 from his Small paper with the images of homoligand nanoparticles from JACS 2007 paper. Aren’t they visually the same? Yes or no?
It is sad that such low level of science and manipulation of data persisted for 8 years. Fortunately for all of us, there are a number of STM experts in the world who can take a look at his ****raw**** unprocessed data and dismiss them as artifacts.
LikeLike
Pedrag, you have written some serious accusations here (cherry picking, bogus tricks,…). If I were you I would stick to scientific arguments and avoid extrapolation and hyperbole (just a friendly piece of advice).
As for your comment on Fig. 3,
“Connect the dots in any possible way, and you will get “ripples” in all directions: horizontal, vertical — all on the same sub image. For example, look at image (c). Can you by yourself, and not looking at (e) identify any preferential direction? The same thing applies to b and d, h and j. Now, g and i , and l and n, are a bit more believable.”,
I very strongly disagree. I look at the three top panels (a,f,k) in Fig. 3 and I can see the alignment of the dots without help from the bottom panels. I bet most people would agree with this statement.
As for your comment on Fig. 4 (panels b,e), I can see two different scans; clearly they are not identical.
LikeLike
@pep:
pep, you are apparently out of this field. Nothing wrong with that, neither is this my area of expertise (although, it was for a year). But fortunately for both of us, there are many STM experts that are more qualified to judge the quality of this work. I worked with Stellacci for two years, and you can read about my experience in my guest blog entry.
Going back to Figure 3:
Unfortunately, we disagree. By looking at (c) , I can connect the dots , and the orientation will go at 60 degrees ( currently in (e) its ~120: notice that Stellacci connected three dots on the lower right edge and extrapolated the line). Now consider the lower left of the same nanoparticle in panel (c). Are you sure you can’t see THREE parallel lines at 60 degrees?). The fact that the two of us are seeing different things and looking at the same image, is the actual proof that this figure demonstrates nothing. This is not a quantitative method to determine nanostructure on top of these nanoparticles, let alone conclude and measure distances.
Panel (c) —and the rest— are ambiguous, because they are ***digital zooms*** of a larger image. In the STM community, making inferences about molecular level features while performing 100nm x 100nm scans on corrugated surfaces, are very mildly put, scandalous!
Figure 4:
Pep said: “As for your comment on Fig. 4 (panels b,e), I can see two different scans; clearly they are not identical.” Did we just agree on something here 🙂 ? The point of my argument in this Figure was that if there is a square on a nano particle surface , when you rotate the substrate, it will be a square — not rhomboid or parallelogram. ***The surface features can not be distorted by rotation*** Figure 4, again, is misleading the reader. Let’s decompose the problem. We are looking at the blue and green nanoparticles. First, look at the green nanoparticle in (f) and compare it with the same nanoparticle in (e). How did he extrapolate orientation from this? Now, blue nanoparticle in panel (c). Find it in (b). How again are you extrapolating orientation there? Now, the blue nanoparticle in (f) looks better. Again, orientation can be as well zero degrees, while Stellacci indicates 120 degrees. But nonetheless, topologies neither on the blue nor on the green nanoparticles, are ***not*** the same.
Bring in one more person to this comparison “analysis”, and we will have a different opinion. How is this quantitative?
Regarding cherry-picking the data: how do you call picking blue and green nanoparticles in panels (c) and (f) in Figure 4 ? Have you asked yourself, what is happening with the rest of the nano-particles in Figure 4 and why were they excluded from the analysis? Where are they in the Supporting Materials?
Now, bogus tricks. How do you call zooming in on data and presenting that as scans, as in all Stellacci publication? Coloring and rendering 3D surfaces and applying low-pass filters so the data doesn’t look pixelated? Pep, this is shameful. This is not honest practice.
For the hyperbole, I am so sorry about that. I get excited with Christmas music over here in the US. It’s everywhere! By the end of the Xmas season last year, I learnt Michael Buble’s songs by heart!
Cheers.
Pedja.
LikeLike
Pedrag, it seems to me that you are committing the same sin you are accusing Stellacci of: cherry-picking data to support your arguments.
That is, in Fig. 3 you now only mention panel c, which is the visually more difficult to discern (sure, it is either ~60 or ~120 deg). But the direction of the stripes in all the other panels (g,h,l,m) will for sure be clear to almost everyone who looks at them.
Now, as for digital zooms of larger scans, I have seen many in the literature, as well as blurry images when measurements are close to the limit of resolution of the technique, where you have to focus on the area with best contrast (this is not cherry picking, but picking the signal out of the noise). For examples, look at Fig. 3 in http://dx.doi.org/10.1038/NCHEM.1488 or http://dx.doi.org/10.1038/nature02823.
As for Fig. 4, indeed, the dots on the scans are far from conspicuous. Although on my monitor (a retina macbook pro) I can in fact distinguish the orientation of the aligned dots pretty well, it may not be straightforward to everyone (maybe try to increase the contrast of your monitor and see whether you see the dots better). But in any case, you don’t have to focus only on this figure. There are other published figures that show stripes rotating with scan direction: for instance, Figs. 8 and 9 in http://dx.doi.org/10.1021/ja061545h.
Once more, as I mentioned in comments earlier (also to Raphaël) if you want to disprove a finding, you have to consider all the existing evidence for the finding, not only a few selected points. Otherwise, you are discrediting yourself.
LikeLike
@pep:
thanks for sharing [1,2]. Those are indeed some great pieces of work, based on STM and AFM imaging, respectively. You gave me something really good to read as a morning exercise. You quoted excellent measurements, something that I am proud to see in Nature publications.
But I am surprised that you missed the fine print in these publications, which is essential to justify publications’ credibility and consequnetly, their high impact. In particular, the authors in [2] clearly demonstrate their imaging protocol — the procedure of online zooming in — first, they start with a scan size of 100-200 nm in Figure 1 and then progressively continue to zoom-in, as shown in Figure 2: “This higher-resolution scan clearly shows that there are no core complexes in these regions. Scale bar, 50 nm (a); 25 nm (b)”. The authors performed higher resolution scans to demonstrate the features in higher resolution that are clearly not noise. This imaging practice is the complete opposite from the STM imaging style in [3,4] : the imaging starts from the scan size 100nm x 100nm and there it stops, as if the limit of STM had been reached. In fact, the limit is what you showed me in [1]. The figures in [3-4] are just pure photoshopping (cropping, smoothing and filtering), thus misleading the reader that these images are obtained at higher resolutions at smaller scan sizes, while in fact, the resolution hasn’t changed. Indeed, Philip Morairty demonstrates how these unprocessed images look like. In order to achieve molecular resolution in the order of 5-8 A, higher resolution scans must be performed. In particular, STM images acquired in [3-4] are recorded in 512×512 resolution at the scan size of 100nm. So the actual limit imposed by the authors is 2 A. The Figure 4 in [5] is another example of zoomed in and filtered noise — it brings no new information, yet it is an altered image used to persuade the reader that it is not an artifact. Contrary to good and honest imaging practice demonstrated in [2] , Figures 8 and 9 in [4] do not disclose the original scan size, so the reader is unable to judge the precision of these measurements. More alarmingly, the insets in Figure 3 in [4], as well as in Figure 1 in [3] are just filtered zooms of the features that are identical to the features obtained by STM imaging of unfunctionalized surfaces, as I demonstrated clearly in [8].
I am very glad that you brought one of the central issues in the controversy by mentioning the limit of resolution of the STM technique. Figure 2 in reference [1] is indeed demonstrating the limits of STM. This is precisely why this publication deserves its place in a high-impact journal: it show unambiguously individual molecules in unprecedented resolution, by performing very tedious and difficult scanning. You will notice that the authors in [1] did not scan 100 nm areas to look at the subangstrom features in their images: they performed scanning of the area which enabled them under high resolution scanning to achieve subangrstrom resolution. Unfortunately, [3-4] do exactly the opposite: they scan large surface areas to obtain sub angstrom features, as shown in Figures 13,14 and 15 in [4], which puts a big question mark on these results, given the fact that their self-imposed resolution limit is 2 A, which is an order of magnitude higher then the limit that you pointed out in [1].
I would like to return a favor and familiarize you with another high-impact measurement that accelerated the field of non-contact AFM [6]. The research world was looking at these results in awe and many did not believe and challenged Giessibl’s measurement. In response to these challenges Giessibl responded with the technical comment [7] and I would like you to take a look at the Figure 1A. The middle image in Figure 1A shows topography error signal derived from the frequency error signal (deviation of the actual frequency shift from the set point). Now, every STM scan records the deviation of the tunneling current from the set point (in AFM imaging, thats what Giessib reports). What happens when this deviation is one to two orders of magnitude from the set point and it happens to oscillate? I think the authors of [3,4] have the response to this. Their entire STM imaging is erroneous because its corrupted with feedback oscillations. The authors in [3,4] have never apparently published such tunneling current error data, and that also puts a tremendous doubt, as well as intention, of their measurements.
Finally, I think Retina display is amazing! I have it too, and I am enjoying it greatly!
cheers,
Pedja.
[1] http://www.nature.com/nchem/journal/vaop/ncurrent/full/nchem.1488.html
[2] http://www.nature.com/nature/journal/v430/n7003/full/nature02823.html
[3] http://www.nature.com/nmat/journal/v3/n5/full/nmat1116.html
[4] http://pubs.acs.org/doi/abs/10.1021/ja061545h
[5] http://onlinelibrary.wiley.com/doi/10.1002/smll.201202322/abstract
[6] http://www.sciencemag.org/content/289/5478/422.full
[7] http://www.sciencemag.org/content/291/5513/2509.full
[8] https://raphazlab.wordpress.com/2012/12/11/seven-years-of-imaging-artifacts/
LikeLike
@Pedja
Once more, you have to support your criticisms taking into account all the existing evidence, not only a few selected images from one or two imaging techniques. Here a sample of the broader evidence: http://nanoparticles.org/pdf/P2011%20Stellacci.pdf
Again, by keeping your criticisms broad (“Seven years of imaging artefacts”) and your arguments narrow, you are discrediting yourself.
LikeLike
@pep:
Pep, in my, though longer post, I tried to explain that STM measurements in [3,4] are not at the limit of resolution — to the contrary, it’s on the other part of the spectrum — where STM measurements are not performed (that is not what STM is for, your reference [1] clearly demonstrates proper usage of the instrument). I also tried to show that artificially adding sub-nanometre features by extrapolating to higher resolutions is erroneous, and not disclosing the procedure in the papers, is fraudulent.
And I did all of this by scientifically comparing and contrasting the arguments in [1,2] and [3,4]. Your poor response just proved that you either did not get my point, or you did — but did not counter-argued with scientific facts — but circumvented to a PowerPoint presentation, that again, I am accusing of not disclosing imaging protocols — something that is indispensable for validating any STM work.
LikeLike
Pep, excuse the pun but we are going around in circles. My left panel does not assume that the tip scans horizontally at all (as already stated above). For each position (x), you plot the z displacement, i.e. the height that you have had to go up or down. That effectively results in a projection as shown.
You seem to accept that “the run of the tip as it scans the sphere will be longer as it goes higher on the sphere”; have you ever seen a SPM of a square image which was not square?
I have done my best to explain, but you need to understand the very basics of SPM, for example what is the feedback system that allows to keep the distance constant, etc. I would suggest you discuss with a local SPM expert or take an introduction to SPM book.
LikeLike
We are discussing basic geometry, no one needs to be an expert on SPM to understand it I believe. 🙂
Again, you seem to miss the point I am making from the first comment on this page: the height of the stripes is much smaller than the diameter of the nanoparticles. To make it more obvious, imagine that on your new drawing the yellow dots are located just a bit higher (this would be the stripy pattern). When the tip scans along the contour, the differences in height would be located at the yellow points, which are equally spaced on the path the tip follows (as in the right panel of your drawing).
I should then correct your sentence,
“For each position (x), you plot the z displacement, i.e. the height that you have had to go up or down.”
to read,
“For each position (x,y), you plot the Delta_y displacement, i.e. the height that you have had to go up or down.”
And yes, the SPM of a square is a square. The SPM of a sphere (when the tip follows the contour of the sphere) would then not be a circle, but an oval.
LikeLike
pep; it is indeed basic geometry. I have done my best to explain. Is there anyone else out there who does not understand the argument? If that’s the case I’ll spend a bit more time making an extremely clear post with schemes etc.
LikeLike
Thanks, Raphaël, I will be waiting for your further input. While you are at it, I think you should also reply with details to the following *relevant* paragraph from Stellacci’s Response:
“Despite this, ref. [1] raises a valid point about imaging curved surfaces, given that the true tip and the true current trajectories are hard to determine. We have studied this problem in our group by analyzing images of homoligand nanoparticles. For these particles, our images show locally ordered patterns (of dots) that are simply an extension of the 2D crystals that the same molecules form on flat surfaces.[18,19] Hence, the interpretation of images of these particles is more straightforward than for mixed-ligand particles, providing an ideal reference system. We note that the arguments presented in ref. [1] should also apply to the intermolecular distance between adjacent ligand headgroups on homoligand nanoparticles; thus, according to the reasoning of ref. [1], such a distance should significantly decrease at the edges of particles (keeping the same proportionality, the spacing should decrease from 5 Å to 3 Å). As shown in Figure 6 of ref. [15] as well as in new data shown here in Figure 1, single molecules can be clearly identified both in the center and at the edges of nanoparticles, yet no distortions in the intermolecular spacing at the particle’s edges is observed. These experimental observations disprove the main point in ref. [1].”
LikeLike
Pep; I’ll try to address all of your points in a separate post. It may take a little time as you have raised many in the past few days.
LikeLike
@Pep wrote (Dec. 16, 11:09 pm)::
“I very strongly disagree. I look at the three top panels (a,f,k) in Fig. 3 and I can see the alignment of the dots without help from the bottom panels. I bet most people would agree with this statement”
I am absolutely gob-smacked that you would say this. I have shown the data in Figs. 3 and 4 of that paper not only to a number of STM/AFM microscopists but to friends who have no background in science and they all have been absolutely incredulous that those images were published in a serious scientific journal, ostensibly as a credible rebuttal to strong criticisms of previous work.
What those ‘images’ show is a fortuitous alignment of pixels of noise. As I discussed in my “Seeing is Believing? Not always….” post, and as Pedja points out so well in his comment above, it is very easy to trick the eye into seeing patterns where none exist.
Let me say that again — those ‘stripes’ are nothing more than a few pixels of noise. If Yu and Francesco wanted to convince us all of the validity of the stripes all they had to do was carry out a simple experiment — zoom in (in real time, i.e. by reducing the scan area) and take consecutive scans. This is what any competent and careful scanning probe microscopist would do and is the least that one would expect a referee would request.
Pedja’s accusation of cherry-picking is spot-on and is entirely supported by the data. As I mentioned in my “Seeing is Believing? Not always…” post, Francesco sent me the raw data from Figs. 3 and Fig. 4. It was a matter of no more than a couple of minutes to look at the images to see that they had indeed cheery-picked the particular particles they chose to present in the paper. I’ve put together a PowerPoint slide to show this .
Note from that slide that in two consecutive scans the “pattern” in the nanoparticle changes. Yu and Stellacci conveniently ignore the image where the nanoparticle does not show the same pattern in this case but elsehwere in Fig. 4 they claim that they can rotate the scan window and the stripes also rotate. If this isn’t cherry-picking the data, then what is?
By the way, I’d appreciate it – as would the readers of Raphael’s blog, I’m sure – if you could let us know your name. I, for one, am firmly of the opinion that, whenever possible, anonymity on internet forums – ooops, fora – should be avoided (particularly when we’re discussing publicly-funded science). Please do us all the courtesy of telling us who you are.
Philip
LikeLike
Arrgghh. I messed up the link to the PowerPoint slide referred to in the preceding comment. Apologies. Let’s try again…
Striped Nanoparticles Re-Revisited
LikeLike
@Pep (again)…
By the way, when explaining the issues with Stellacci et al.’s ‘offline zoom’ approach to friends who do not have a background in science, the analogy I used was the CSI ‘infinite resolution’ capability. In CSI (the TV programme, that is), fundamental imaging limitations are not an issue – it’s possible to use software to zoom in indefinitely, regardless of the resolution of the original image.
LikeLike
Philip; I would also prefer it pep was to reveal its identity. However, as long as pep does not use too much arguments such as “as an expert in so and so”, I think it is fine and we should deal with the substance (as indeed you and Pedja have been doing beautifully).
LikeLike
@Pep.
I’ve mentioned on a number of occasions in comments here how easy it is for the eye to pick out correlations where none exist, such as in entirely uncorrelated (i.e. Poisson-distributed) data. Here’s a very good example of this effect: Random Thoughts: Points and Poisson .
Philip
LikeLike
Thanks for your input, Philip. I can’t help it but respond to your points:
You wrote: “What those ‘images’ show is a fortuitous alignment of pixels of noise. As I discussed in my “Seeing is Believing? Not always….” post, and as Pedja points out so well in his comment above, it is very easy to trick the eye into seeing patterns where none exist.”
First, if you claim that the alignment of pixels is fortuitous, to support this point you would have to explain how come one sees alignment in so many scans of striped nanoparticles that have been published over the years. Fortuity is not ubiquitous. For a summary, you can look at this presentation I just found: http://nanoparticles.org/pdf/P2011%20Stellacci.pdf
Second, it is crystal clear from your PowerPoint slide (http://www.nottingham.ac.uk/~ppzpjm/Striped_Nanoparticles_re-revisited.pptx) that your criticisms on ‘cherry picking’ and ‘filtered noise’ are not supported. Yes, the same nanoparticle shows aligned dots on the scan on the right and absence of them on the one on the left. But you fail to mention that with such difficult conditions of imaging (apparently close to the limit of resolution of the apparatus), noise is predominant and it is totally normal that in consecutive scans of the same sample the signal does not end up on the same nanoparticle. And you also fail to notice that there are a couple of nanoparticles for which one can see aligned dots on both scans (for instance, the nanoparticle right below the one you have circled).
Now, you will of course tell me again that it is easy to trick the untrained eye to see patterns where they aren’t. And as a general statement it is right. But again, then you will have to explain why there are so many published STM scans with the same type of patterns. In fact, the chances that they all are ‘a trick to the eye’ are essentially null.
And you also argue that the aligned dots within the marked circle on the right image on your first slide are an artefact coming from filtered noise. But then one can see the same aligned dots on the unfiltered image at the top of your second slide stand out from the noise (and not only for the circled particle, but also for the one below). Clearly, the interpolation procedure makes them less blurry.
I of course appreciate that interpolation algorithms can occasionally create localized patterns, as you show on the bottom image on the second slide. But this does not prove your point. A careful comparison of the interpolated and uninterpolated images on your slides shows that no aligned dots appeared from where there were none. Actually, the chances that a proper interpolation procedure converts Gaussian noise into aligned dots is low. I am sure you can do a statistics exercise with your image processing package.
In essence, any trained eye will recognize that your criticisms are not valid.
As a final point, my real name is Pep, and I prefer to remain as Pep on this blog. I hope this is respected. Also, these comments are in a personal capacity only. Thanks.
LikeLike
Pep – thank you for your honesty in confirming that your real name is Pep. Unfortunately, your request for remaining Pep on this blog cannot be respected. You are not an independent observer but an Editor at Nature Materials
who has spent (in your own words) a lot of time preparing the last Stellacci cover(https://twitter.com/PepPamies/status/238679222401507328). Even if you speak here in a personal capacity, it is properly astonishing that you come here under a pseudo accusing the blog of unfairness to our readers when the readers of Nature Materilas (or the Nature group altogether) are yet to be informed of the serious concerns on the stripy nanoparticles (that Nature Materials know of, for at least three years) including the indisputable fact that essential evidence is missing in the latest paper (https://raphazlab.wordpress.com/2012/12/10/gaping-holes-in-the-gap/) in direct contradiction with Nature policies.You are still welcome here, but as Editor of Nature Materials, and I have quite a few questions for you.
(the crossed part is an update following Yann’s comment below; thank you Yann for the correction)
LikeLike
@ Raphaël
You try to make a correspondence between a commenter and his real identity.
I do not know if you succeeded or not, we will have to wait for Pep to give his input on that.
However, Pep wanted some fairness, so I have to mention that you made a mistake in the reference to the Nature Materials cover. The one discussed by the associate editor of Nature Materials and F. Stellacci was actually not the one featuring the latest paper that F. Stellacci and co-authors published there (November issue), but the September issue (words cloud).
LikeLike
@Pep.
First, I am absolutely appalled that an editor of Nature Materials, someone who is far from a ‘disinterested observer’ with regard to the striped nanoparticle controversy, posted here (prolifically) without revealing their affiliation.
You should be ashamed of yourself. Science, of all things, should be as open and honest as is humanly possible. Your posting here without revealing your connection to the work in question is immensely dispiriting and makes me revise downwards my (already low) opinion of editorial standards at NPG in relation to this striped nanoparticle debacle. (This may help explain the rather ‘robust’ tone of my comments below).
Second, your comments on Stellacci’s misinterpretation of noise are laughable. Let’s dissect them one by one…
(i) … how come one sees alignment in so many scans of striped nanoparticles that have been published over the years
*bangs head slowly against table and sobs gently*
Jeez.
‘Alignment’ is regularly seen because almost all of those images result from feedback loop artefacts and/or very poor STM experimental practice.
Slides 2 and 3: Feedback loop ringing, for the reasons highlighted by Pedja is his post. I have requested the error signal (i.e. tunnel current) images associated with those, and other similar images, from Francesco Stellacci. These will give a good indication as to how accurately the feedback loop was tuned. Strangely, I have yet to receive those tunnel current images…
Slide 4: (…and I really hope that you weren’t including this as one of your ‘counter-examples’ to my criticism because, if so, you know even less about STM than I would have thought possible). These are images taken on (atomically) flat samples by other groups. As Pedja has explained at length in his post, there’s a huge difference between imaging atomically flat samples and Au nanoparticles whose radius of curvature may well be comparable to that of the tip.
Slide 5. Same point as for slide 4, except this is the Stellacci group’s work. Note the scale bar. Compare to the size of a nanoparticle.
Slide 6. First, note that these are Janus particles, not striped particles. Second, the image on the right is actually rather compelling and is very interesting. I would like to see images taken with a smaller scan area. But, just to reiterate, those are not showing evidence of stripes.
Slide 8. Nonsense. Pure and simple. Go back and look at the Jackson et al. JACS paper [JACS 128 11135 (2006)] from which those ‘data’ were taken. Look at Fig. 3. Do you, as a Nature Materials editor, really find those measurements convincing? Really?
Slide 11. Artefacts. Again. Where is the error signal image? Why didn’t anyone who reviewed this work ask to see how the fundamental quantity in STM (the tunnel current) behaved during imaging?
I could go on but you get the message.
Let’s move on.
(ii)
Yes, the same nanoparticle shows aligned dots on the scan on the right and absence of them on the one on the left. But you fail to mention that with such difficult conditions of imaging (apparently close to the limit of resolution of the apparatus), noise is predominant and it is totally normal that in consecutive scans of the same sample the signal does not end up on the same nanoparticle.
*Begins to twitch uncontrollably (a la Herbert Lom in those classic Pink Panther films)*.
What?
WHAT?
Your argument here is that you can interpret one image of noisy pixels as stripes but that it doesn’t matter if you never reproduce that pattern because the experiment is “difficult”.
That…just..beggars..belief.
And, no, the experiment is not intrinsically noisy. Our group does UHV STM and NC-AFM for a living. Have a look at this: Atomic Switch
or, better, see what the IBM Zurich group can do:
Submolecular resolution
or the tour-de-force experiment of the Manoharan group (Stanford) earlier this year (this time using STM manipulation; such beautiful work):
Molecular graphene assembly .
You’re a Nature Materials editor. You’re familiar with this work, right?
(iii) “And you also fail to notice that there are a couple of nanoparticles for which one can see aligned dots on both scans (for instance, the nanoparticle right below the one you have circled).”
*Breaks down and weeps uncontrollably*
Please tell me that this is some type of elaborate wind-up?
Those are pixels of noise.
The images are not reproducible.
How often do we have to say this?
The images in Yu and Stellacci’s response are below the standard I would expect of a (weak) undergraduate project report, let alone to be published in a prestigious journal.
(iv) ” In fact, the chances that they all are ‘a trick to the eye’ are essentially null.”
Each and every image suffers from some type of artifact due to poor STM technique. Under these circumstances the chances that they are ‘a trick to the eye’ are substantially greater than null, and approaching 100%.
(v) Actually, the chances that a proper interpolation procedure converts Gaussian noise into aligned dots is low. I am sure you can do a statistics exercise with your image processing package.
…sigh…
You entirely miss the point (again). I am not arguing, at all, that the interpolation process introduced the alignment. I am saying that it *accentuated* the alignment. Interpolation will remove higher Fourier components, smoothing the image and introduce a higher degree of *apparent* spatial correlation into the image.
This is basic, undergraduate stuff. You might find the notes at this University of Nottingham website useful: Applications of Fourier Analysis
Philip
LikeLike
Apologies. The “Atomic Switch” link in the post above is: Atomic Switch ,
although the IBM Zurich and Manoharan group videos are better in any case!
Philip
LikeLike
@Pep.
In the cold light of day, the comment above is clearly somewhat ‘over-heated’.
If you are still reading this blog, I apologise for some of the more intemperate language I used. The comment was basically a caffeine-fuelled, stream-of-consciousness rant which stemmed from my deep surprise that you were a Nature Materials editor but had not thought it worthwhile to disclose this.
Nonetheless, my criticisms regarding both your lack of professionalism and your arguments on the validity of the data in question stand. The idea that a fundamental lack of reproducibility in experimental measurements is fine (and to be expected) because the research is ‘difficult’ is particularly worrisome.
Once again, my apologies for the ranting.
Philip
LikeLike
@pep:
” But you fail to mention that with such difficult conditions of imaging (apparently close to the limit of resolution of the apparatus), noise is predominant and it is totally normal that in consecutive scans of the same sample the signal does not end up on the same nanoparticle. ”
Its apparent that you don’t understand STM at all. You have personally sent me a paper that shows the limit of the STM. 100 nm in three orders of magnitude above the current limit. I am absolutely flummoxed by this comment — not only that it demonstrates your lack of knowledge of SPM experiments, but it furthers my postulate that you can’t read Nature publications critically — something that one would expect from an editor of the same publishing group that published the work you sent me.
LikeLike
Raphaël,
1. My comments on this blog are strictly in a personal capacity. I only discussed scientific, not editorial, matters, and backed up my statements. I only used public information. Pep is not a pseudo, it is my real name.
2. Indeed, I spent a lot of time preparing the September 2012 cover of Nature Materials: http://www.nature.com/nmat/journal/v11/n9/covers/index.html
The cover on the last Stellacci’s paper in Nature Materials is the November cover, which was published on Oct 23. I wrote the tweet you link to above on Aug 23.
3. There is no contradiction whatsoever with Nature Publishing Group policies. Your submission in Nature Materials failed to pass peer-review.
4. By making sweeping statements on the basis of partial information, you are not keeping your readers properly informed. As previous comments show, you have failed to back up some of your criticisms with solid scientific support. Importantly, you have not respected my fair request to remain as Pep on this blog. You have already discredited yourself sufficiently, and have now lost my trust.
5. I do not longer believe that I can be treated fairly here. Therefore, this is my last comment on this blog.
LikeLike
It is reasonable to join a discussion in a private capacity. However, I would also suggest that professionally, there are times when one shouldn’t join in the discussion and that instead it is better to move to a different part of the “room”.
One example in my life is when I am on a grant panel. Should informal discussion over lunch or during a break involve applications, for which I have a conflict of interest (from my institution or a collaborator or a personal friend), then I make my excuses, simply stating “I shouldn’t be hearing this”, smile and move elsewhere. After all, if I am not in the room (quite rightly, and I wouldn’t want to be there) when the applications are formally discussed, I also do not want any part in informal discussions.
So as an editor, I would suggest that a better course of action would have been to encourage the protagonists to engage in an active letter writing exercise (to your journal, great for its visibility), rather than posting your own comments.
Moreover, as an editor, you have a duty to pronounce, in due course and after a thorough investigation, into the clear self-plagiarism that has occurred. To remind ourselves, data re-use has been highlighted in this blog and in my own (http://ferniglab.wordpress.com/2012/12/17/over-the-line/ ) relating to a figure in Uzun et al., Chem Commun (Camb). 2008 (2):196-8 and one in Verma et al.. Nat Mater. 2008 (7):588-95.
So I think it would have been better to stay above the fray, but to quietly seek external advice as to what courses of action you, as editor, might have available.
In the end, as I posted on my blog, Errare humanum est sed perseverare diabolicum (http://ferniglab.wordpress.com/2012/12/12/errare-humanum-est-sed-perseverare-diabolicum/). These are wise words indeed. We should learn from mistakes, not persist.
Remember, like an editor, I too have to tread a very careful line, because I have managerial responsibilities. One of these is the integrity of all my staff, for which I am responsible. This is an edict that has come down recently from up high, and which I interpret as a consequence of the University’s difficult experience when it innocently hired a Professor, Alirio Melendez, (here (http://1608ab.wordpress.com/2011/10/06/melendez-el-al-not-yet-enough/) and here (http://ferniglab.wordpress.com/2012/02/29/research-integrity-ii/) whose work elsewhere was subsequently exposed as serial fraud.
LikeLike
Regarding the data re-use, the onus is on Nature Materials, since the image was first published in Chem. Commun. So, when the re-use of data was pointed out some days ago on Raphael’s blog, there should have been an immediate check and then a request for information from the authors as to why this occurred. I will note here that I formally contacted Nature Materials on Sunday on this matter. I would expect an acknowledgement fairly promptly, though, given how busy people are and the proximity of the festive season, it is reasonable to consider that we could be sometime into the New Year before anything formal happens.
To quote Bernd Pulverer, Head of scientific publications, European Molecular Biology Organization ” Figures, images and data are subject to the same rules as text.”
LikeLike
http://bit.ly/XUVj6G
LikeLike
@pep:
Sir, while I much welcome your decision not to participate any longer in this debate, I hope it does not save your job. When, so far, neither Stellacci, nor any representative of the laboratories that have reproduced his work or collaborated with him, have opted to voice their views on this site, what on earth has motivated you to meddle with this under an ambiguous alias? Are we to understand your comments now as Nature Materials position on this dabate, or are they just the musings of an editorial clerk who has temporarily run out of control? In addition, your pseudo scientific comments give embarrassing insight in Nature Materials’ editorial shortcomings. I will no longer submit my work to Nature Materials and remain by wishing you a peaceful and reflective festive season.
LikeLike
Mathias, it is not strictly true that there has been no response from the lab or Francesco Stellacci. Francesco Stellacci’s work is being aired elsewhere, albeit indirectly albeit uncritically. However, he himself has also tweeted, though just once “Francesco Stellacci ?@frstella@NeilWithers @jendtweeting I hope people will look carefully at the science in this, and not go for a witch hunt.”
There has not been a witch hunt, instead people have been extremely professional and looked at the science very carefully and have found it most wanting. I agree that a full response from Francesco Stellacci on the apparent weaknesses of his data and on the reason behind the re-use of data in two pairs of his papers is required and surely he is fully aware of this. One simple explanation for the lack of response here or elsewhere is that he is now trawling the data archive of his group to produce a scientifically credible response…. …though even a one liner to this effect would be reassuring to the entire community, but perhaps he is too busy even for that…
I also note that as of November 2012 the Student Experience at EPFL includes Project 6 “Analysis of STM images of mixed-monolayer coated nanoparticles”. I would hope that this project takes on board the critiques aired here, so that the student receives the appropriate training in the rigour that must underpin all scientific endeavours.
So we wait…
LikeLike
http://bit.ly/XUVj6G
LikeLike
Dear Pep,
I have been silently watching updates on this blog over the last few weeks, and am, like most readers I guess, quite amazed by what I am witnessing. I am not going to comment on the obvious conflict of interest your anonymous participation in the discussions creates, I believe Mathias Brust, Philip Moriarty, Dave Fernig and others accurately described most reader’s feelings. I appreciate your choice not to comment on this blog, but trust you are still reading it.
Regardless of the message you were trying to convey or your motivations to do so, I really do not understand the method. Nowadays, there are still ways to remain anonymous on the internet; using your real name (or even just your first name) is not one of them. For the record, a single Google search for the terms “Pep, Chemistry, Simulation” (those elements you gave away yourself in your first posts) leads straight to the Nature Materials Editorial Board web page (and a few peptide computational studies also). Since you are not new to social medias (believe it or not, I am also following your own blogs and tweets), I would expect you to be aware of those privacy concerns.
Anyways, if you do change your mind about not raising your point here now that your name and accreditation have publicly been clarified, I hope you can let us all know for what reasons you felt compelled to hide from the audience of this specific blog, when you have had no restrictions signing other comments with your full name elsewhere in the past (for example, comments here, here, here, here or here, ).
Thank you.
PS: Since we are debating potential conflict of interests and connections to parties involved in this controversy, I should hereby disclose for transparency concerns that I have worked with Raphael in Liverpool during my Ph.D. (2006-2009). I also worked with Molly M. Stevens (who co-authored some of the papers implicated here, see this link and this other one) at Imperial College (2010-2011). However, I have never personally been involved in the work discussed here. I do not believe my objectivity can be questioned, but will be more than happy to discuss this point if needed.
LikeLike
http://bit.ly/XUVj6G
LikeLike
“3. There is no contradiction whatsoever with Nature Publishing Group policies. Your submission in Nature Materials failed to pass peer-review.”
As far as Nature Publishing Group policies are concerned, I was not thinking of my submission but of the total absence of evidence to support essential claims. For example, the latest article in Nature Materials is based on 6 samples, 3 of which are supposed to be stripy, 3 of which are supposed not to be. There is no evidence at all for 5 of the sample (https://raphazlab.wordpress.com/2012/12/10/gaping-holes-in-the-gap/).
I thought that claims which are at the core of a research ms ought to be supported by evidence according to Nature Publishing Policies. Apparently this is not the case.
LikeLike
One other very important point with regard to Pep’s post and, in particular, his comment:
But you fail to mention that with such difficult conditions of imaging (apparently close to the limit of resolution of the apparatus), noise is predominant and it is totally normal that in consecutive scans of the same sample the signal does not end up on the same nanoparticle.
Yu and Stellacci themselves argue that they can rotate the scan window and that the ‘stripes’ in a *specific* nanoparticle rotate with the scan window.
What they therefore tacitly admit is that they believe that they can see the same features in the same particle in consecutive scans.
..but they have cheery-picked the data to show this: they hunted to find some correlations in the noise that they could interpret as ‘rotated’ features.
They (and you, Pep) can’t have it both ways. Either the stripe patterns are indeed reproducible from scan to scan so that the scan window can be rotated and the stripes rotate accordingly, or the patterns are entirely irreproducible due to ‘predominant noise’ as you put it.
Philip
LikeLike
Anonymous, at Doug Natelson blog, commented that (): “Just as a FYI for the people involved in this discussion: I think a person that may be able to mediate here (not here, but at Nature) may be Liesbeth Venema. I believe it was she that got the first atomic resolution carbon nanotube STM images in Cees Dekker’s group. Carefully analyzing the corrugation in such images (not spherical but cylindrical) should discriminate between the two camps with respect to the 2D-3D projection arguments.”
I still do not understand Pep/FS projection argument. I do, however, understand very well the one made by Venema et al (Fig 3 reproduced above). This is an interesting point (note that this is not related to scanning, just to geometry of the object). A quick calculation indicates that the periodicity of the stripes would go from (1 nm, 0.9 nm, 0.6 nm, 0.3 nm) in the case of the vertical projection (Cesbron et al) to (1.1 nm, 1 nm, 0.7 nm, 0.4 nm) in the case of a “Venema” projection. This is still not compatible at all with what is observed by FS and collaborators.
LikeLike